Retail merchandising has shifted from experience-based decisions to measurable, data-driven execution. As shelf space becomes more competitive and shopper behavior more complex, retailers and CPG brands increasingly rely on planogram software with analytics to guide space allocation. The ability to visualize shelf layouts, test assortments, and measure performance at the shelf level is now a core capability for profitable brick-and-mortar operations.
What Is Planogram Software With Analytics?
Planogram software helps retailers design and manage shelf layouts by defining product placement, facings, and shelf allocation. When analytics are added, the software goes beyond visual layout and connects shelf decisions to measurable performance.
A planogram tool with analytics allows teams to evaluate how shelf space translates into sales, margin, and inventory efficiency. Instead of treating shelves as fixed layouts, retailers can measure productivity per facing, per shelf, or per category.
This approach is a foundation of physical shelf analytics (brick-and-mortar), where shelf space is treated as a measurable asset rather than a static constraint.
Why Retailers Need Planogram Analytics in Brick-and-Mortar Stores
Brick-and-mortar retail faces constant pressure from rising costs, limited shelf space, and changing shopper behavior. Without analytics, planogram decisions are often based on historical habits or supplier influence rather than performance data.
Planogram software with analytics helps retailers:
- Identify underperforming SKUs and facings
- Allocate space based on actual demand
- Improve category productivity
- Reduce out-of-stocks and overstock situations
- Support fact-based negotiations with suppliers
By linking shelf layouts to sales and inventory data, merchandising teams gain a clearer understanding of how shelf decisions impact overall store performance.
Key Analytics Features to Look for in Planogram Software
Not all planogram platforms offer the same analytical depth. When evaluating solutions, retailers should focus on features that directly support decision-making.
Shelf Space Productivity Metrics
Effective tools measure sales, units, or margin per facing and per linear meter or foot. These metrics help teams understand which products truly justify their shelf allocation.
Assortment and Category Performance Analysis
Analytics should show how changes in assortment affect total category performance, not just individual SKUs. This is critical for range optimization and space planning.
Planogram Compliance and Execution Tracking
Instead of relying on abstract audits, planogram execution is managed through a structured workflow. Approved planograms are distributed to stores, where they are implemented by store teams. After execution, stores submit photo reports directly from the sales floor, allowing the central office to review real shelf conditions, verify compliance, and make necessary adjustments. Merchandising teams can track planogram statuses across locations, clearly seeing which layouts have been executed and which require follow-up. A dedicated mobile application simplifies this process for store managers, enabling faster execution, easier reporting, and more consistent planogram compliance across the network.
How Real-Time Shelf Performance Tracking Improves Merchandising
Retailers increasingly rely on real-time shelf space performance tracking tools to respond faster to changes in demand and execution issues.
With access to frequent or near-real-time data, merchandising teams can:
- Detect performance issues earlier
- React quickly to out-of-stocks
- Validate new assortments faster
- Adjust shelf space based on current trends
Even when true real-time data is not available, daily or weekly updates provide a significant improvement over static planograms.
Most Popular Planogram Software With Analytics
The market offers a wide range of planogram solutions, each targeting different retailer needs. Below is an overview of widely used platforms known for their analytical capabilities.
NielsenIQ Spaceman
A long-established enterprise solution used by global retailers and CPG brands. It offers deep category analytics and integration with broader market data, though it often requires significant resources and training.
DotActiv
DotActiv focuses on category management, clustering, and assortment analytics. It is commonly used by large grocery and pharmacy chains with mature category management processes.
ShelfLogic
ShelfLogic emphasizes data-driven shelf optimization and scenario modeling. It is often selected by teams that want strong links between shelf layouts and sales performance.
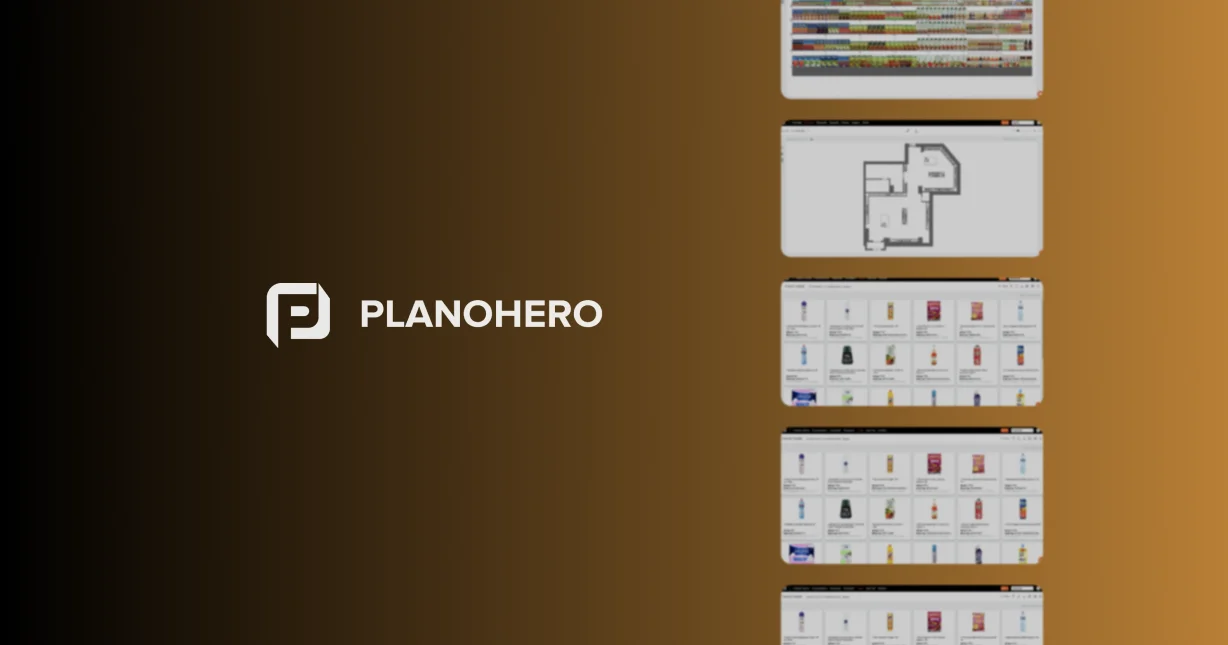
PlanoHero
PlanoHero is an affordable planogram software option designed for retailers and brands that need analytics and reporting. It supports data-driven shelf planning while remaining accessible for mid-sized teams.
Quant Retail Planogram Software
Quant is known for powerful rule-based automated planogram generation and detailed performance visualization, supporting both micro and macro space planning.
Which Planogram Tool Offers Better Analytics: ShelfLogic or DotActiv?
DotActiv is well suited for strategic category management, assortment planning, and long-term space optimization. ShelfLogic focuses more on shelf-level productivity, simulations, and faster feedback from performance data.
Retailers focused on tactical shelf optimization may prefer ShelfLogic, while those emphasizing category strategy often choose DotActiv.
Cost remains a key factor for many retailers. Affordable planogram software that offers analytics and reporting typically focuses on essential performance metrics, clear dashboards, and faster onboarding.
These solutions allow smaller and regional retailers to adopt data-driven merchandising practices without the overhead associated with large enterprise platforms.
How Planogram Analytics Improve Shelf Efficiency and Sales
When used consistently, planogram analytics help retailers:
- Increase sales per square meter
- Improve on-shelf availability
- Reduce low-performing SKUs
- Align shelf layouts with shopper behavior
- Improve collaboration between merchandising and operations teams
By applying physical shelf analytics (brick-and-mortar), shelves become a measurable and optimizable part of the retail value chain.
Choosing the right planogram software requires balancing analytical depth, usability, integration, and cost. The most effective solutions connect shelf layouts with performance data and support continuous improvement.
As competition in brick-and-mortar retail intensifies, planogram software with analytics is no longer optional, and solutions such as PlanoHero demonstrate how analytics-driven shelf planning can be made accessible while still supporting professional merchandising and category management needs.
What PlanoHero Can Do
PlanoHero supports a wide range of analytical capabilities, including:
- Network Sales Analysis – understanding sales performance across all stores and clusters
- Product Display (Merchandising) Analysis – evaluating how different shelf placements impact sales and turnover
- Store Plan Analytics – assessing how store layout decisions influence category performance
- Planogram Analytics – measuring the effectiveness of individual planograms and comparing planned vs. actual execution
These analytical layers allow retailers to connect shelf decisions directly with commercial results and continuously refine assortment and space allocation strategies.
Key Performance Metrics Available in PlanoHero
PlanoHero provides clear, business-focused KPIs based on sales and inventory data, including:
- Turnover (Revenue) – Total sales value for the selected period, calculated from sales receipts.
- Profit – Difference between sales revenue and product cost, enabling profitability analysis by SKU, category, or shelf.
- Sales Quantity – Number of units sold within a category or assortment during the selected period.
- Number of Receipts – Total count of sales transactions (excluding returns), used to evaluate customer traffic and conversion.
- Stock Quantity – Quantity of products in stock at the end of the selected period, based on inventory data.
Price – Average selling price of a product over the selected period, calculated from receipt data.
Looking for a service to create planograms?
Try a free demo version of PlanoHero